Posts tagged ‘inverted head and shoulders’
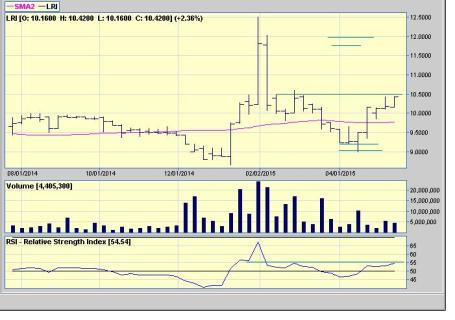
Reference Chart – LRI
Possible bullish case: inv head and shoulders. at smp pf group: lri weekly. say x = 1.230 to 1.50, then x target = 10.50 + 1.30 / 1.50 = 11.80 to 12. need to break the rsi resistance (in green)
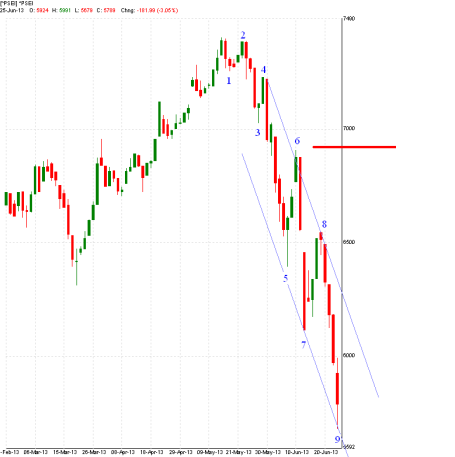
PSEi EW by EW Cute Master Chanerm – Updated
Previously Last June 26
Updated Chart of Elliott Master Chanerm pogi
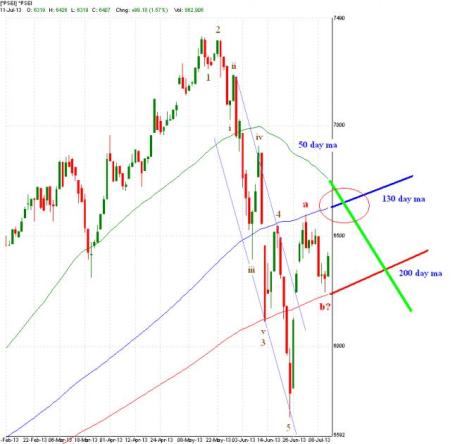
On his July 2 post at Finance Manila
I’ve relabelled the 9 swing count earlier into a more conventional 5 wave impulse, with a subdivided 3rd wave.
as what i mentioned earlier, we needed a break of the downtrend resistance, and the market didn’t disappoint. As can be seen on the chart, the market gapped right on top of the resistance and rallied.
i’ve shown the 50sma, 130sma and 200sma lines on the chart above. It’s interesting to note how today’s high touched the 130ma and reversed. (perhaps to humor locals who prefer a 65/130/260 system, versus the more traditional 50/100/200. A nod so to speak?)
From an Elliott perspective, the market rallied to the initial resistance marked by wave 4. As a guideline, we can typically expect corrections to go the level of the extreme of the 4th wave of a lesser degree, which in this case is the 6900 area marked by the red line in the previous chart. Today’s high at the wave 4 area was just a bit over a 50% retracement. That, and today’s red candle (bearish engulfing) certainly adds weight to the argument that our initial rally is done, and we should look for a correction to a higher low.
So where would the higher low be at? Instead of doing fibo retracements (and those charts have been posted elsewhere), let’s rely on the simple moving averages. in this case, the 200ma line. The 200ma line (currently at 6195) is more or less a 50% retracement of Wave A. So assuming that today’s high marked the completion of wave A up, and we’re looking for a higher low wave B, then the 200ma line should be acting as our support.
By the way, anyone see how the confluence of the 130 and 200ma’s suggest the possibility of a bullish head and shoulder pattern forming? Of course, if it’s that obvious, the market will be killing that idea soon enough 👿 but it’s still something to keep in mind. And of course, if the 200ma line doesn’t act as support, then my suggestion is to take extra precaution with your portfolio.
His latest post at Finance Manila, July 12
nothing much to talk about, so the initial retracement appears in 3 waves, and we bounced. Of course, the 200ma was a key in the bounce, just as the 130ma was a key in the resistances…
can anyone see the iceberg coming on the way? is the market a battering ram? 😉
short discussions on the head and shoulder pattern can be found in the Market Outlook and the FM Technicals thread
—
Source: Finance Manila – Hit the Beach with Waverider and BartenderMD!
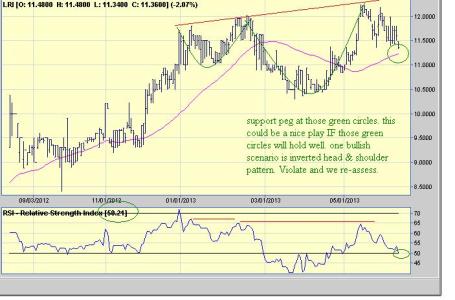
Reference Chart – LRI Update
Previously: Last May 29, we note a divergence threat on the stock as it flirts the 12 peso level.
Daily Chart


Recent Comments