COVID 19 Philippines at Extreme Parabolic High Risk Condition.. Let there be a PARABURST! Burn covid Burnnnnnnn!!!!
July 8, 2020 at 10:54 am Leave a comment
Pls Lord… let there be a Paraburst (the end of a parabolic run) .. we’ve been monitoring the chart of covid19, 7-day moving average here in the Philippines, and initial pattern way back then was that it’s manifesting into a parabolic structure (more at twitter @spyfratscall). This is the same parabolic structure we are now seeing in some of the big names in US stocks like $TSLA $REGN and even $GOLD long term parabolic structure that we’ve been discussing at BoH Society. Please see Eight (8) Charts below.
Credits: Pethuel Pomaloy @PethuelP, @bn_trader and Edson Guido @EdsonCGuido via twitter
Chart 1: July 8 twit of @PethuelIP

Chart 2: May 11. Initial manifestation of Covid 19, 7-day MA into a parabolic structure fractal by @bn_trader

Chart 3: June 19. I was asking for an updated chart as covid’s parabolic structure entered the V/wedgie stage where the 2nd fomo run (the last of it) is about to begin (breakout of wedgie). The July 8 twit is what we are praying and hoping of that last fomo run (peak of parabolic structure)
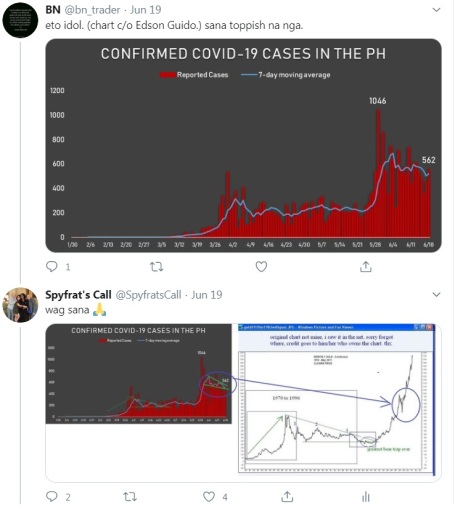
Chart 4: Feb 5. Early $TSLA Road map we studied and discussed back then at BoH Society.
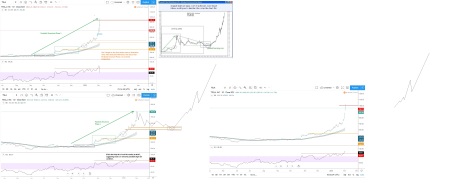
Chart 5: My presentation at the Bear market Summit 2020, discussing $GOLD and $REGN long term parabolic structures.

Chart 6: April 20. twit and thread: $GOLD Long Term Parabolic Structure at BoH Society. $4k target 2024-2025
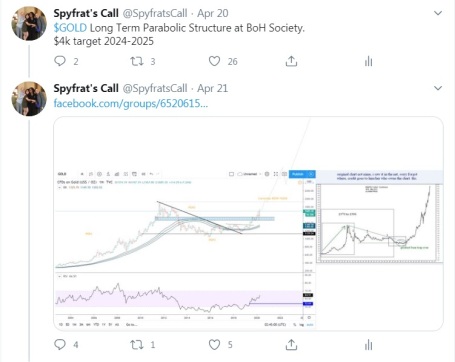
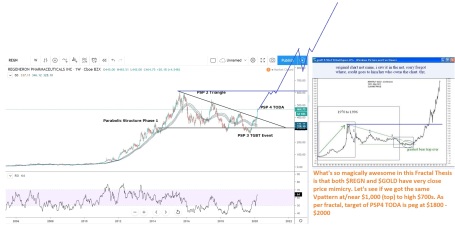
Chart 7: March 3. Assignment at BoH Society: $REGN

Chart 8: March 6. $REGN Long tern Parabolic Structure Fractal with notes
Entry filed under: Phisix's Closet (PSEi).


Trackback this post | Subscribe to the comments via RSS Feed